Play Ball!
Interactive games help design & test new insurance products
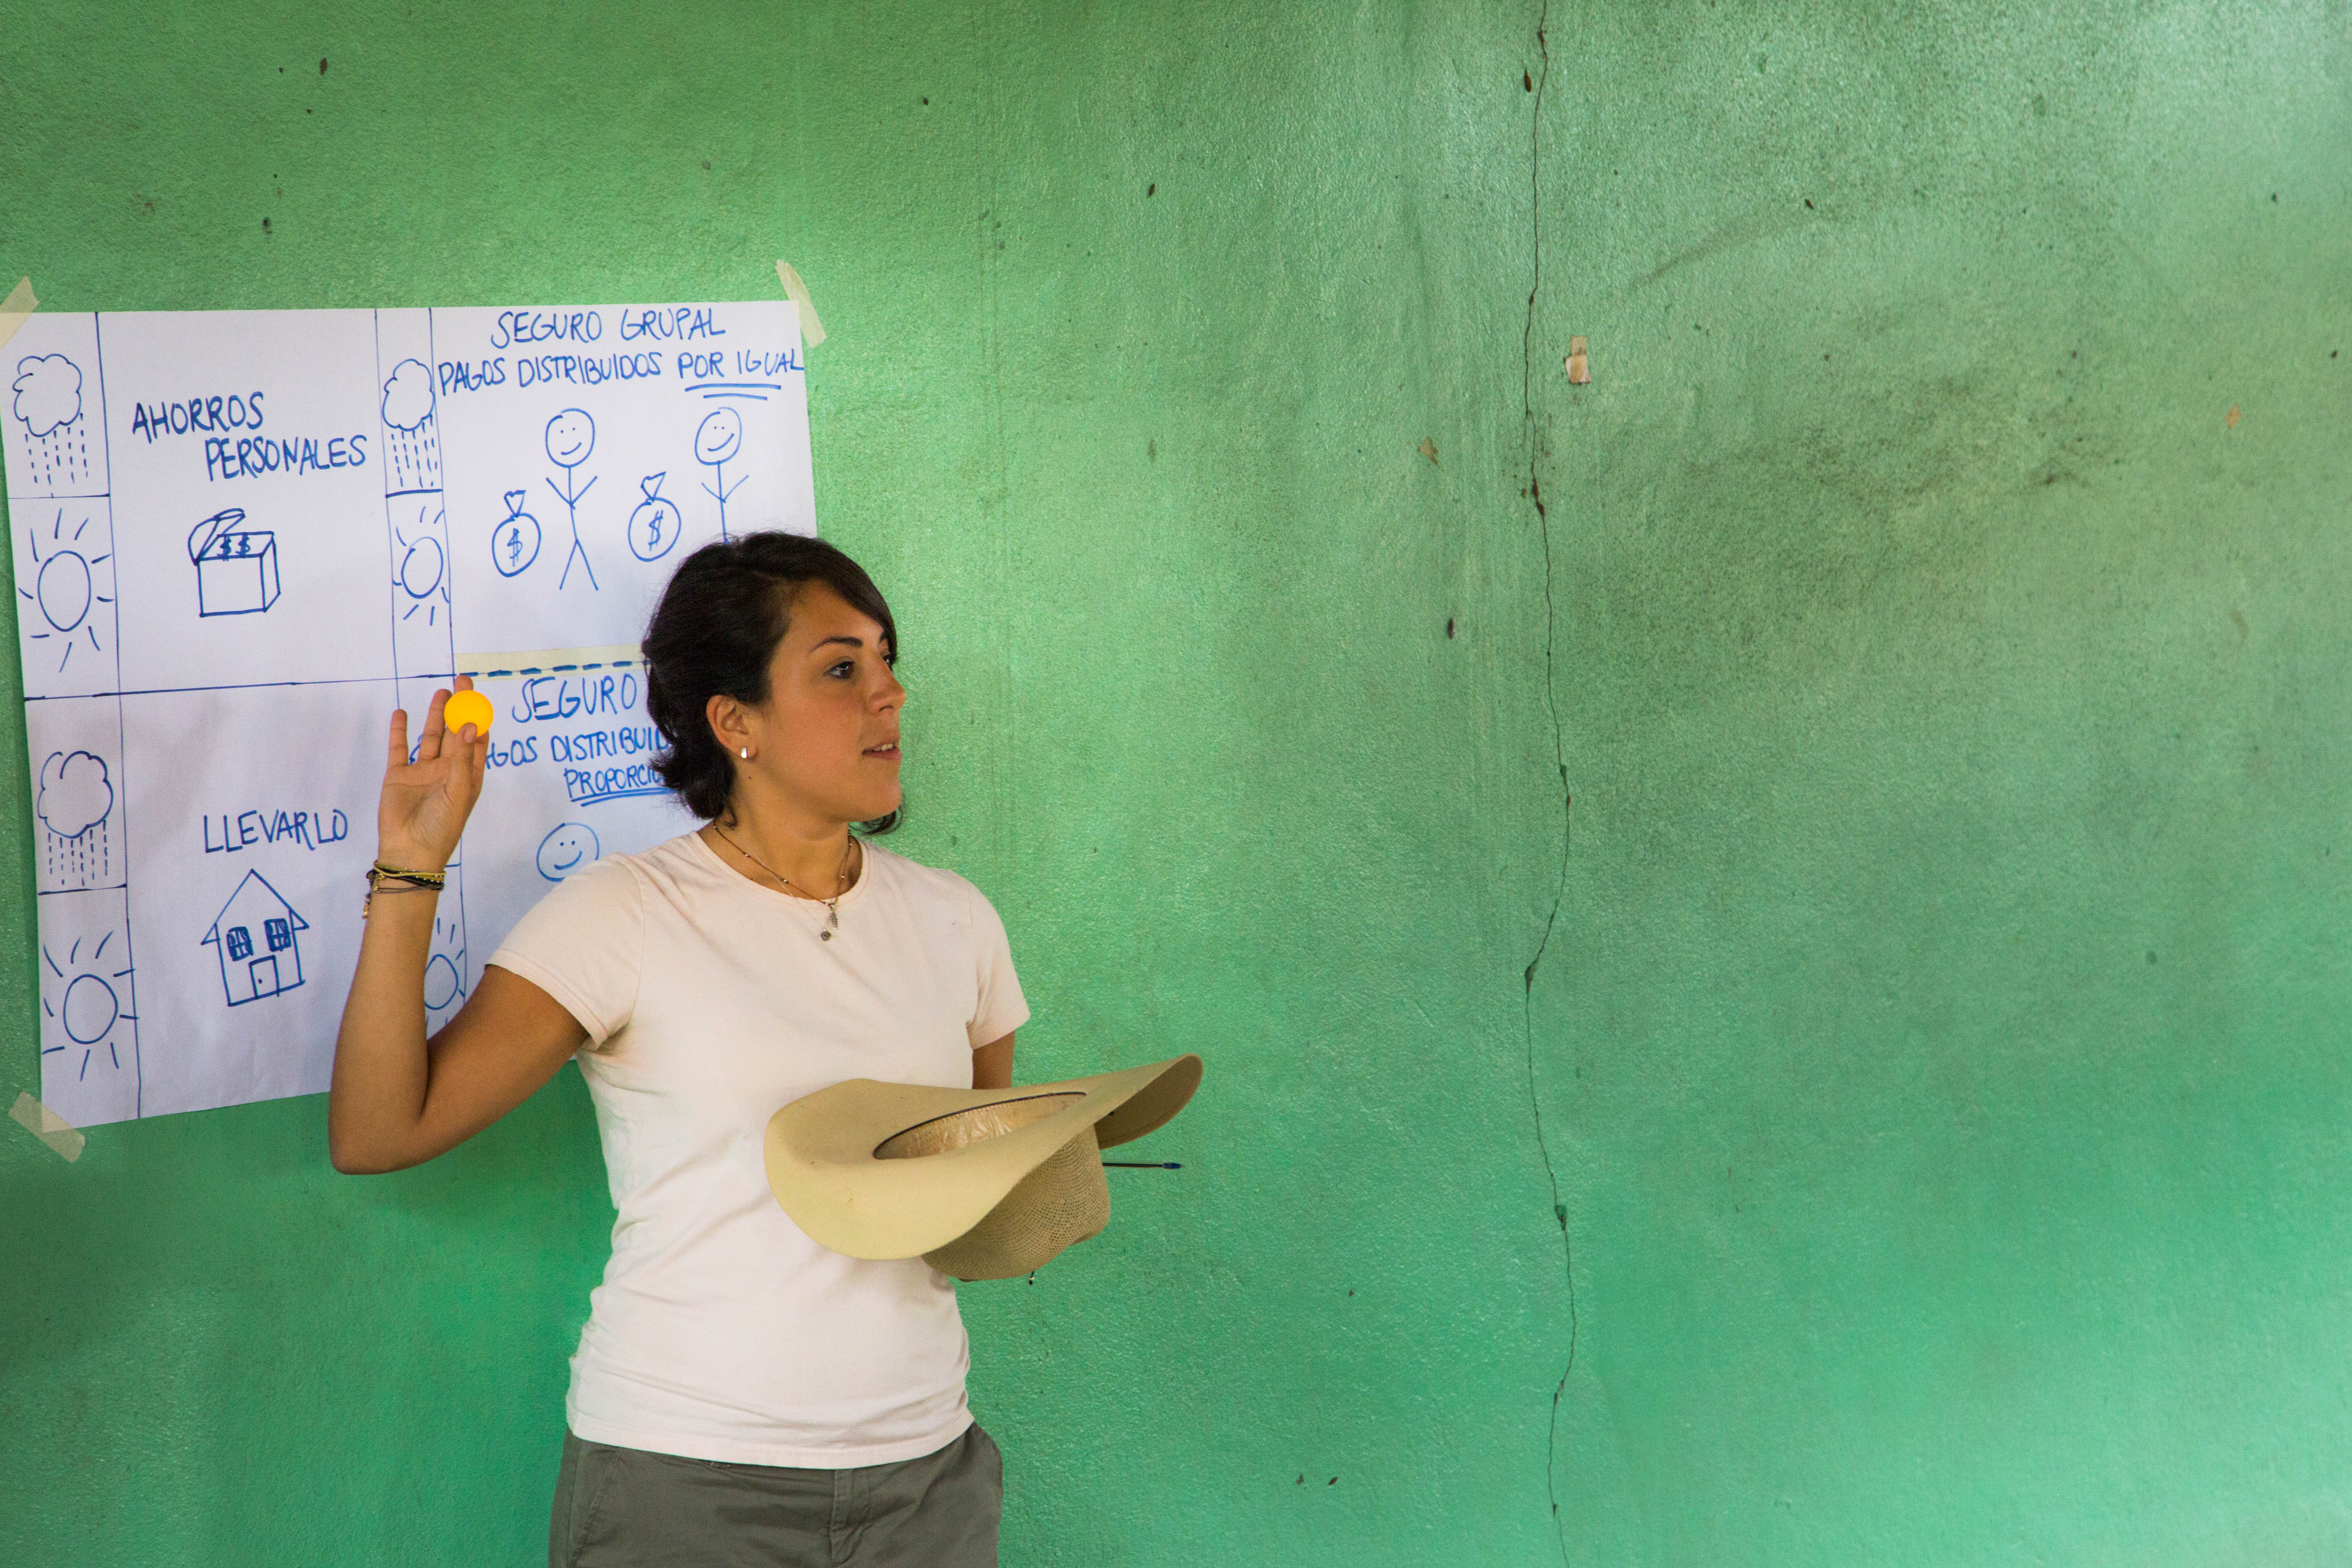
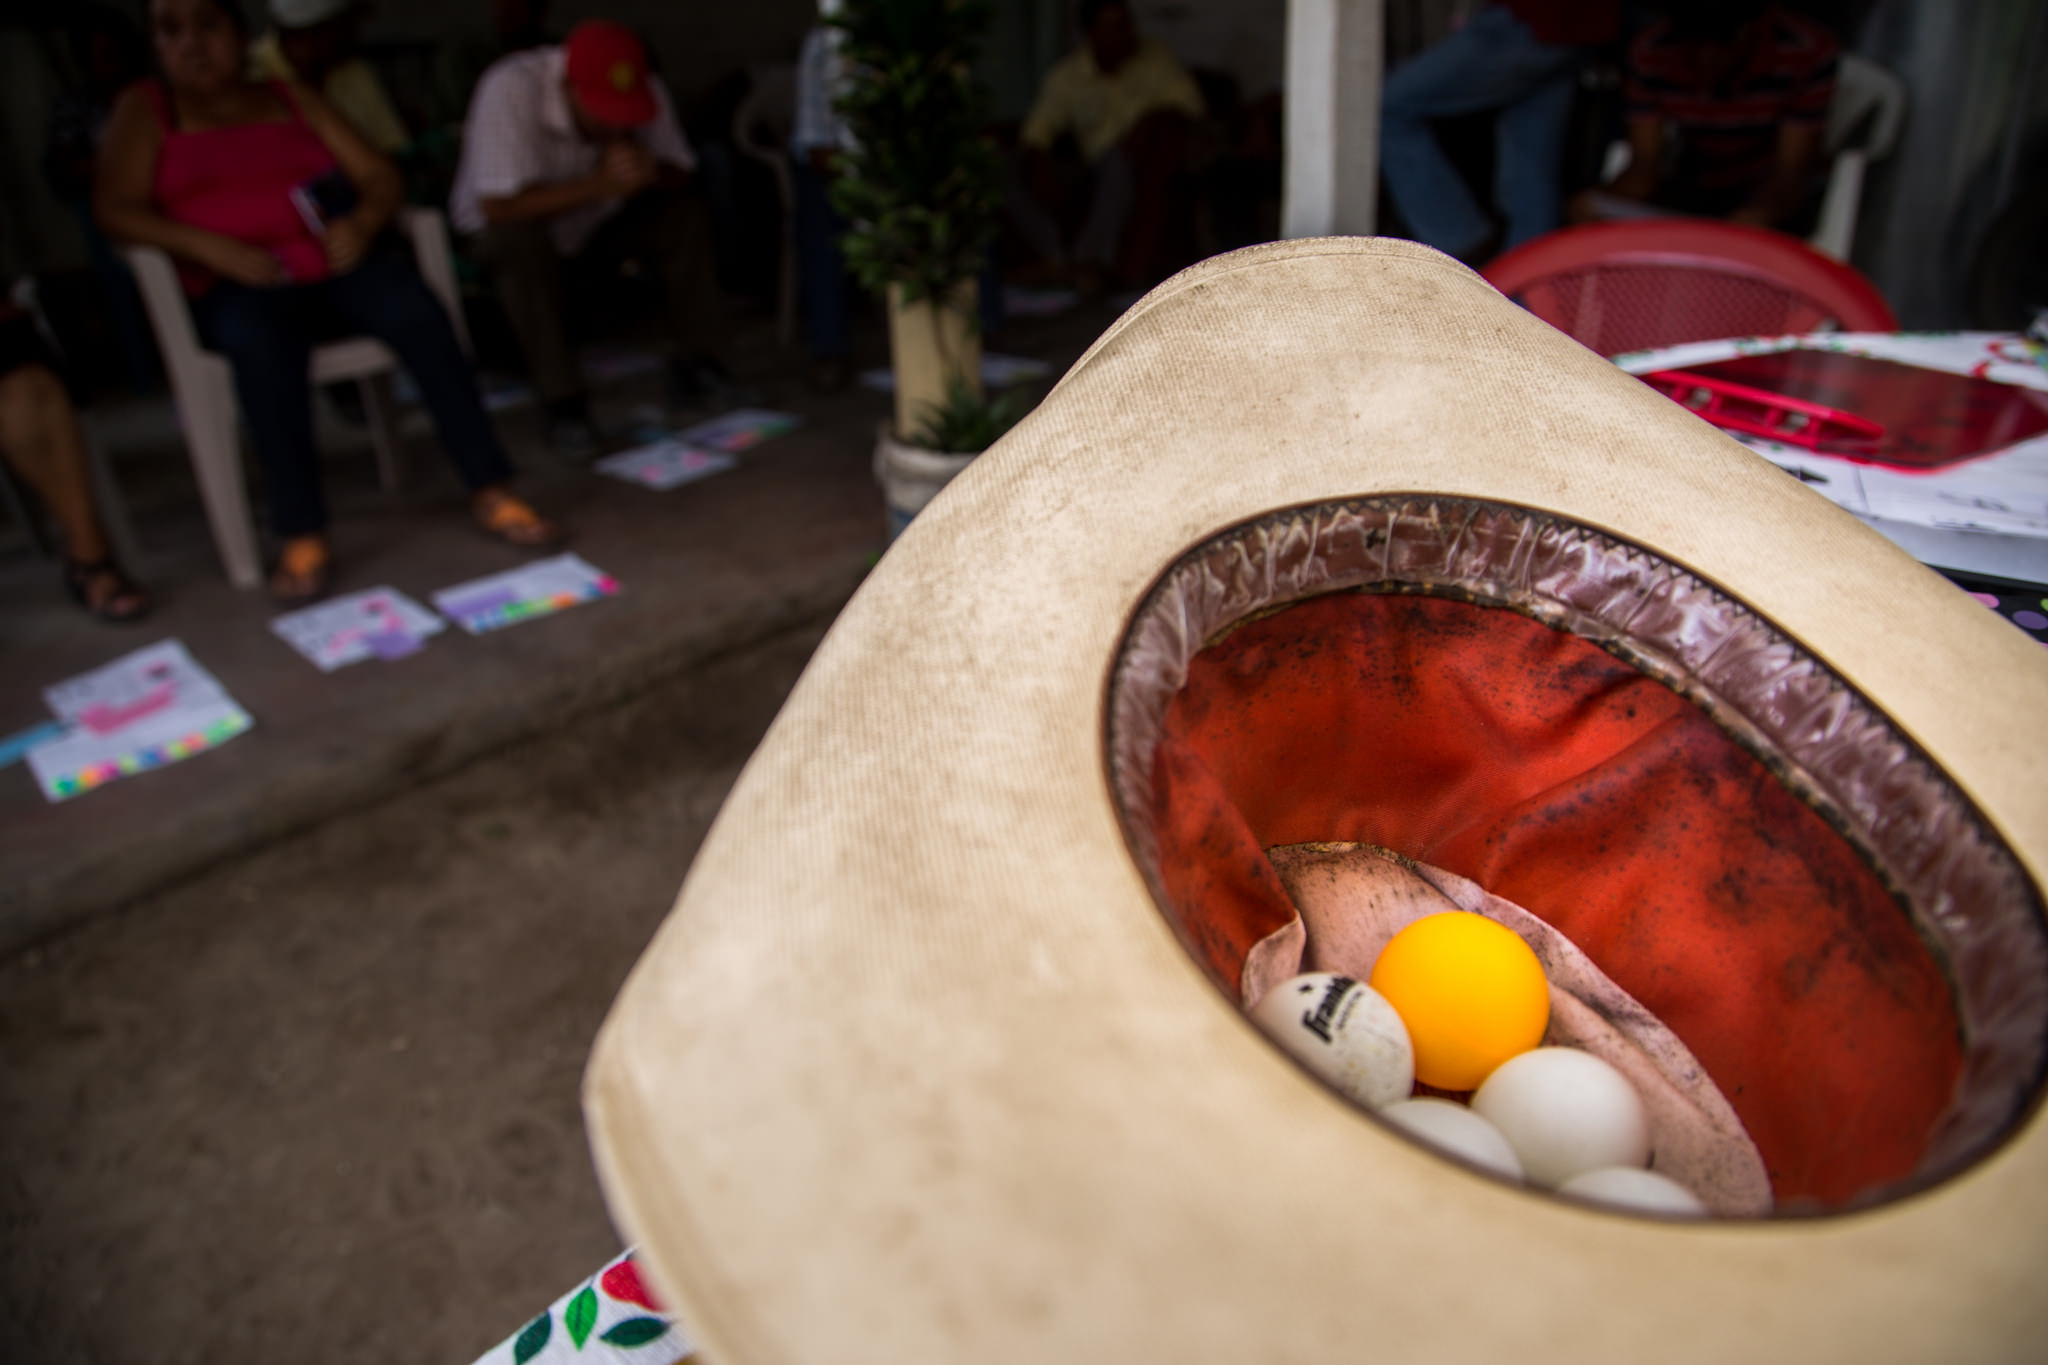
Sofia Martínez holds a sombrero upside down, rattling the five ping-pong balls contained inside. Four are white, one is neon orange.
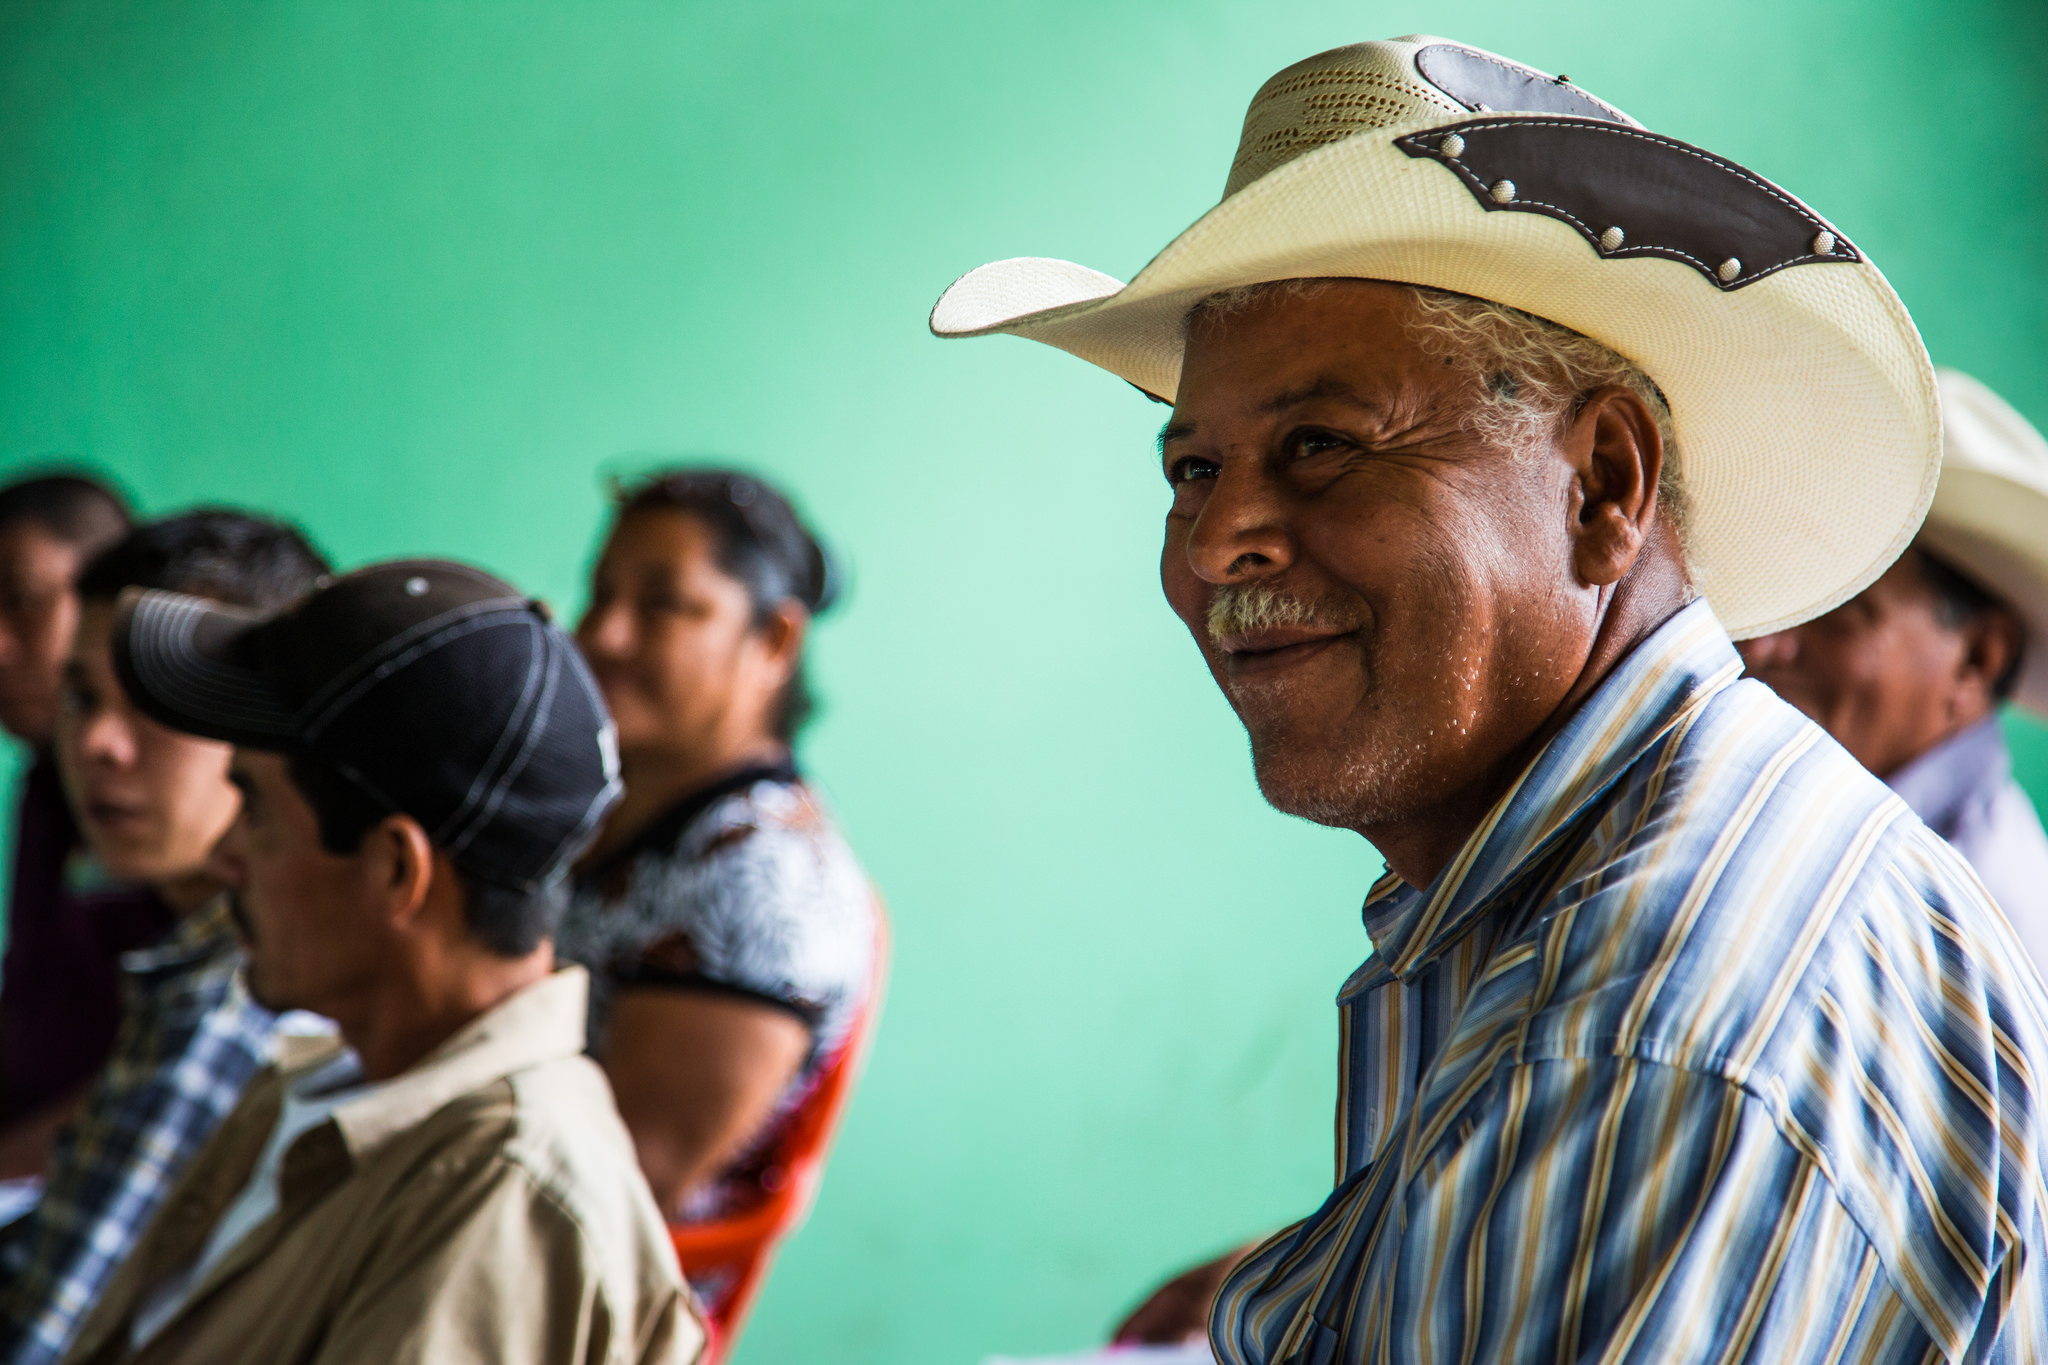
She extends the hat to a farmer seated on a pew. About a dozen or so other farmers have also shown up for today’s activity in a one-room church in the community of Aldea de Agua Morada, in southern Honduras. Most of the farmers gathered in the church are men, many of them dressed for a business occasion, not fieldwork, in collared shirts and dress shoes. Bright red crepe paper wraps the church’s wooden rafters, punctuated by paper flowers in yellow, green and white. More flowers—roses, lilies and daisies made of plastic and cloth—surround the podium-sized altar, which is draped by a light blue cloth printed with the 23rd Psalm, in Spanish.
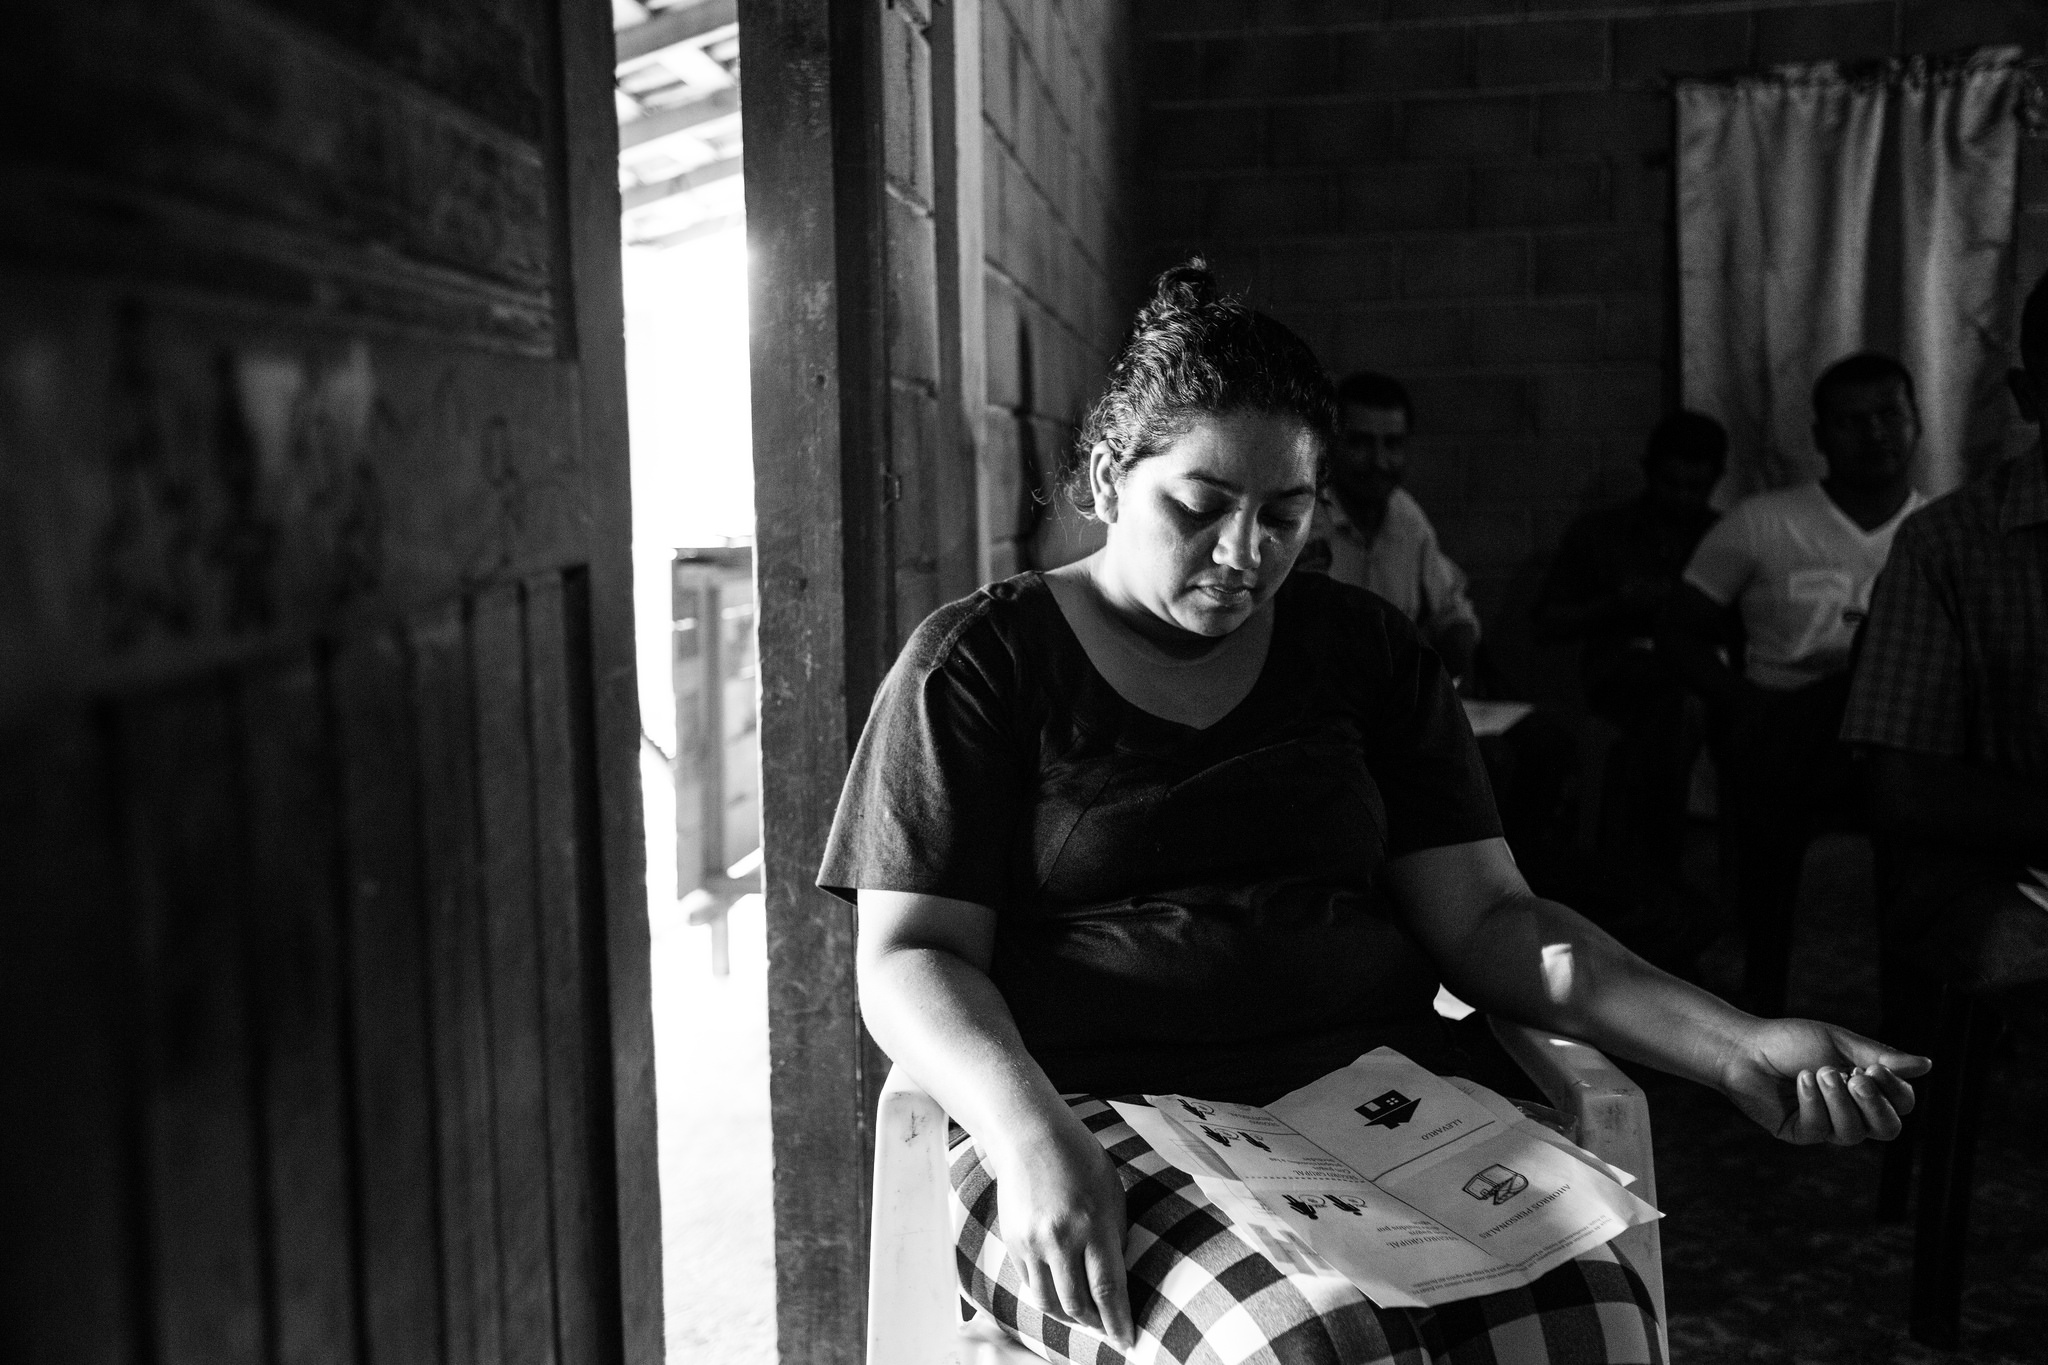
The farmer to which Martínez extends the sombrero is one of two women in attendance. Her long dark hair is pulled back into a low pile, and she’s also dressed up, wearing a spaghetti strap dress with chunky-heeled sandals. She blindly pulls a ball out of the hat and hands it to Martinez, who holds it up for the room to see.
“Salio blanco. Que signfica?” Martínez asks the group. “Significa que no hay pago del seguro.”
The ball is white, Martínez says, which means there is no insurance payment for this round of the game.
Top-notch Science, Bottom-up Impact
The scene above took place in early May 2015. Martínez, a member of the International Research Institute for Climate and Society’s Financial Instruments Sector team, was facilitating ten sessions with farmer groups in southern Honduras over the course of a week. The sessions used a ratio of one orange ball to four white ones to represent the probability (here, 1 in 5) that an insurance-triggering drought would occur in a given season. The farmers went through a simulation of multiple seasons, making various decisions related to a theoretical insurance product during each round. The activities were one component of an ongoing effort by the team that combines behavioral economics, agricultural science, and satellite data science.
The team’s goal is to co-create with farmers a crop insurance product designed to financially protect the farmers during severe drought, particularly in places where farmers wouldn’t otherwise have access to an insurance product. When a project is over, the team hopes that farmers can buy an affordable insurance product that’s offered and managed by local and national institutions.
Government leaders in other countries are calling and asking if their country can be next.
Martínez leads activities in Latin America and the Caribbean—the team also has projects in Africa and Asia—and has been working in Honduras since 2014. Most of the activities there have been funded by the CGIAR’s Research Program on Climate Change, Agriculture and Food Security (CCAFS).
Dan Osgood, the team’s lead economist, said that the CCAFS mandate calls for working with local partners from the beginning of the project, and in such a way that everyone is involved with the scientific process of the project, not just the logistics or the administrative components. In Honduras, they’ve worked with local university researchers, the Ministry of Agriculture and Livestock, insurance companies and the Comisión Nacional de Bancos y Seguros—the country’s insurance regulator. Osgood credits this deeper, integrated involvement with the success of the project.
“Participatory processes have always been a big component of our work, but this is on a whole new level,” said Osgood. And it’s working.
Osgood said this process makes it much more possible for these local and national institutions to sustain the project’s innovations after donor money is gone.
Martínez said the local insurance company is excited about moving forward with the new financial tools, and so are other institutions. “Even the agriculture ministry and the insurance regulator are really thinking through what it means to include these tools in wider programming,” she said.
The demand in Honduras for continuing these tools is at a level the team hasn’t seen before in their projects around the world. The local insurance company, Seguros Equidad, is asking when they can start selling the insurance, said Osgood, and ministries of agriculture in other countries are calling up and asking if something similar can be done in their country next.
Key to generating this demand is a bottom-up approach, said Osgood.
At the heart of the team’s work is an approach, perfected over the last five years, that gives farmers the chance to help design the insurance product. The team works in areas where insurance isn’t otherwise available to farmers. Traditional insurance requires a representative to visit communities and estimate actual losses. This process takes time and is prohibitively expensive for many small-to-medium sized farms. In the insurance that Osgood and his team help design, rainfall data from satellite images serves as a stand-in for agricultural losses from drought, making it much cheaper to manage, and therefore affordable for more farmers.
But satellite data isn’t perfect, so the team has to be sure the historical data matches up with real droughts the farmers have faced, otherwise the insurance product could be based on bad data and might not actually help the farmers in the next drought.
The particular success of the Honduras work demonstrates a way forward for applying climate information in decisions around the world.
The group has found that interactive, role-playing games have been the most effective way to ensure they are truly capturing the farmers’ experience, perspective and needs. The games query farmers’ recollections of past years and allow farmers to run through decision-making scenarios similar to those they make in a typical year.
The team’s work on climate risk management in the country goes beyond just index insurance, but the insurance product is key to preventing farmers from going into debt in the driest years. A well-defined product can also help farmers take advantage of good rainfall to be even more productive than normal.
But ensuring the product is suited to farmers’ needs means taking the time to consult with farmers several times. “We rely on using farmer feedback to help define and refine the product in a way that leads to more tailored and less costly products,” said Martínez.
To provide insurance coverage using rainfall amounts throughout the whole season, for example, is likely to be prohibitively expensive. A greater proportion of the season being covered translates to more risk being transferred to the insurance product, making the product more costly.
So, the team focuses their efforts on designing specific windows of coverage appropriate to the risk farmers are unable to otherwise manage.
Delve into the Process
How one element of the insurance—timing of coverage—is designed
The team focuses insurance product design specifically for risk that a farmer can’t otherwise manage. To do this, they work with farmers to identify key periods during the year when a lack of rainfall leads to major losses on farms. This slideshow explains the process to make sure that the farmers’ records of worst drought years in the past matches up with when the insurance product would have payed out.
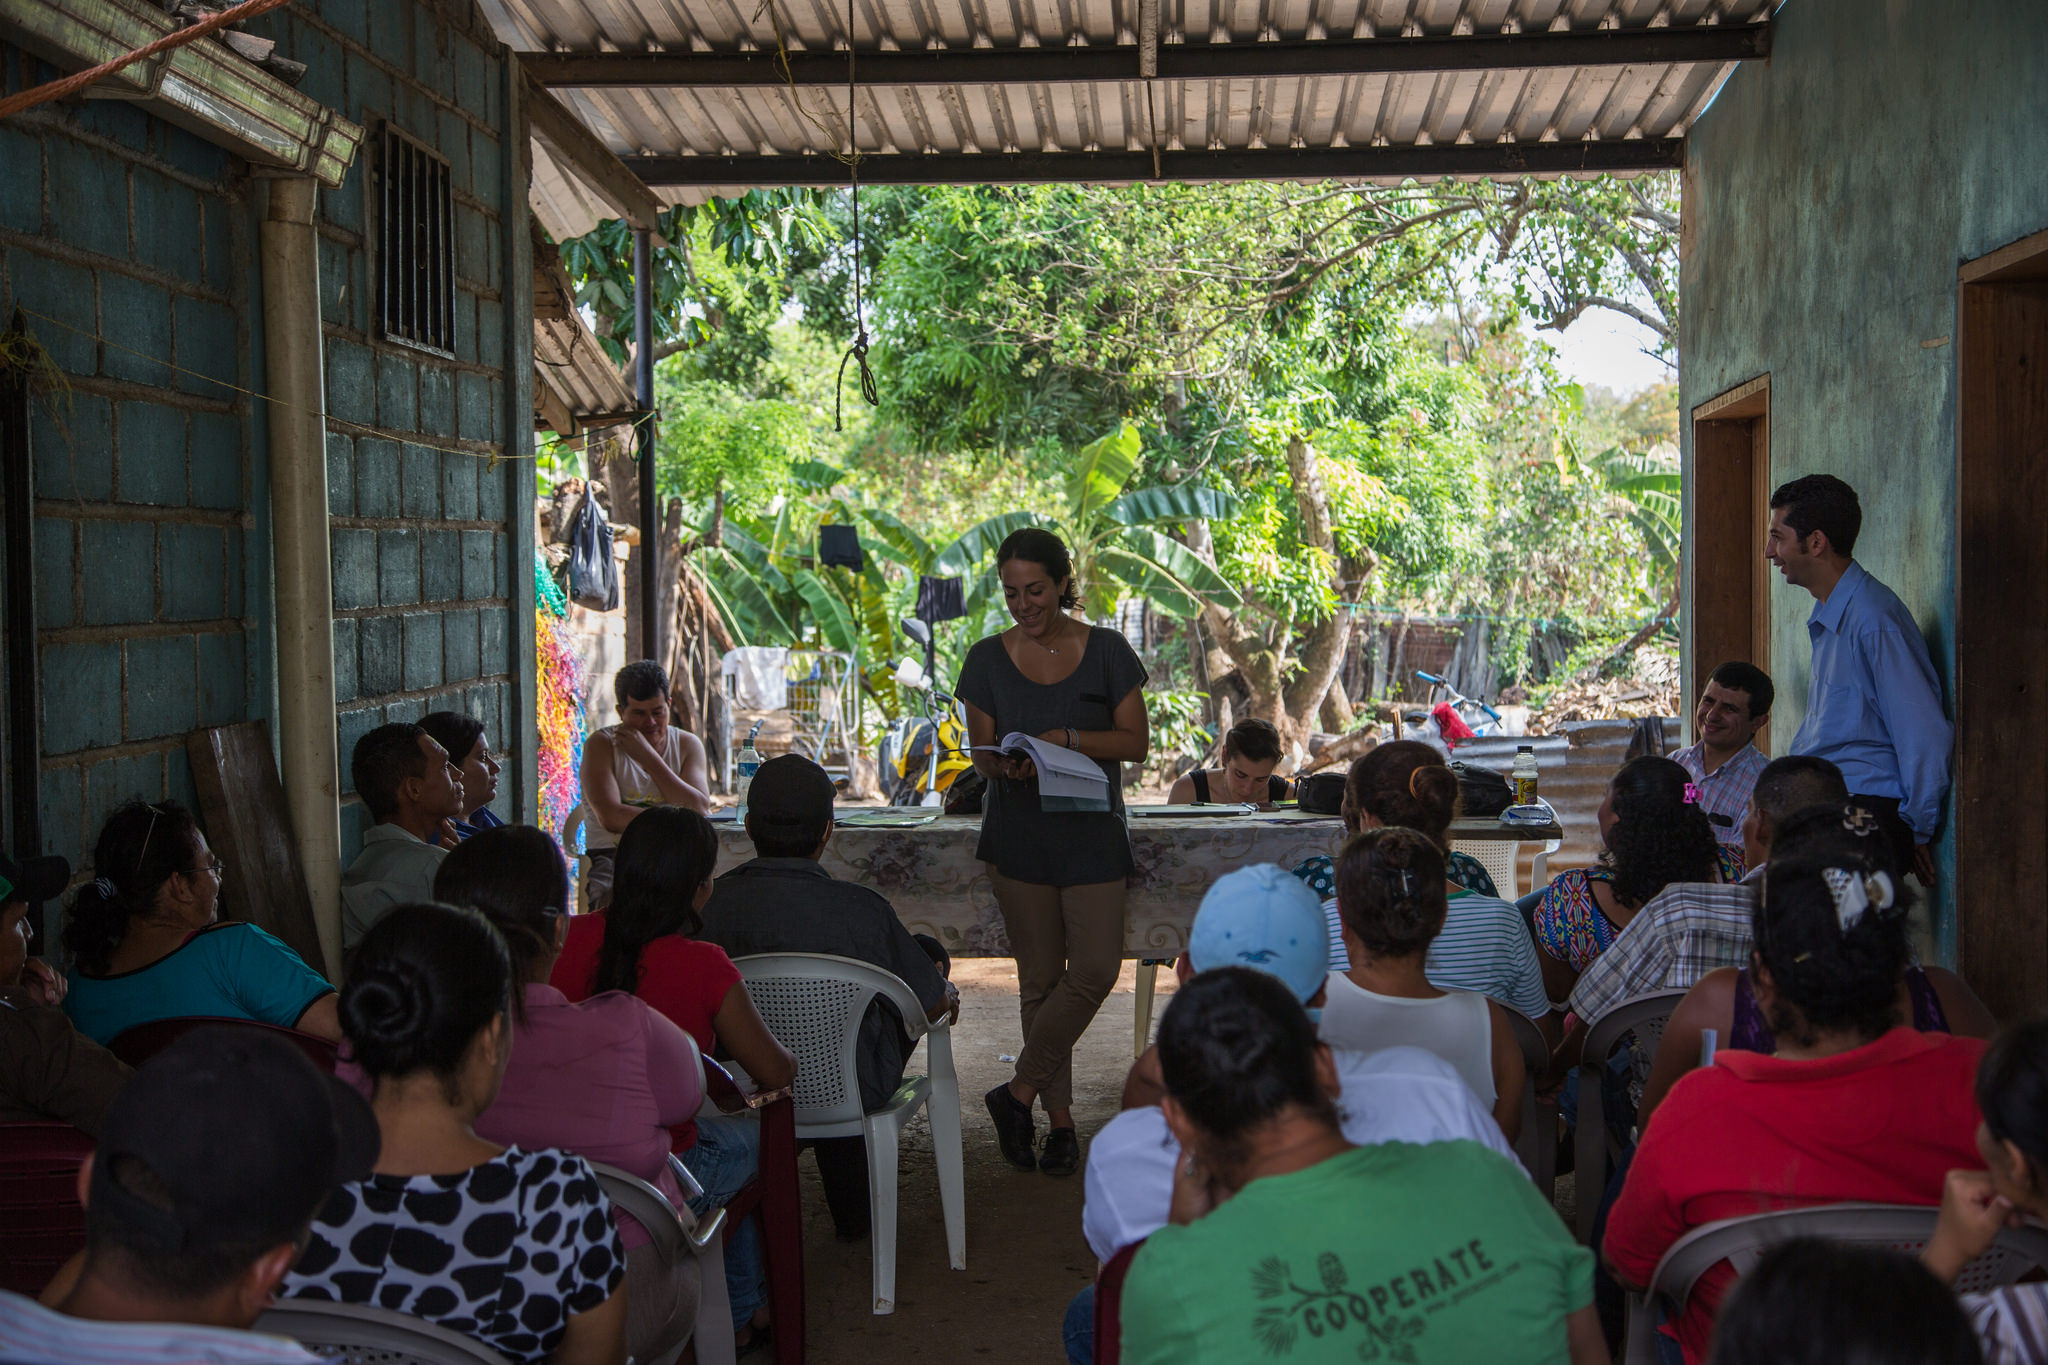
Martínez explains the game process to farmers in southern Honduras. The team focuses insurance product design specifically for risk that a farmer can’t otherwise manage. To do this, they work with farmers to identify key periods during the year when a lack of rainfall leads to major losses on farms. Here’s how that process played out recently in Honduras.
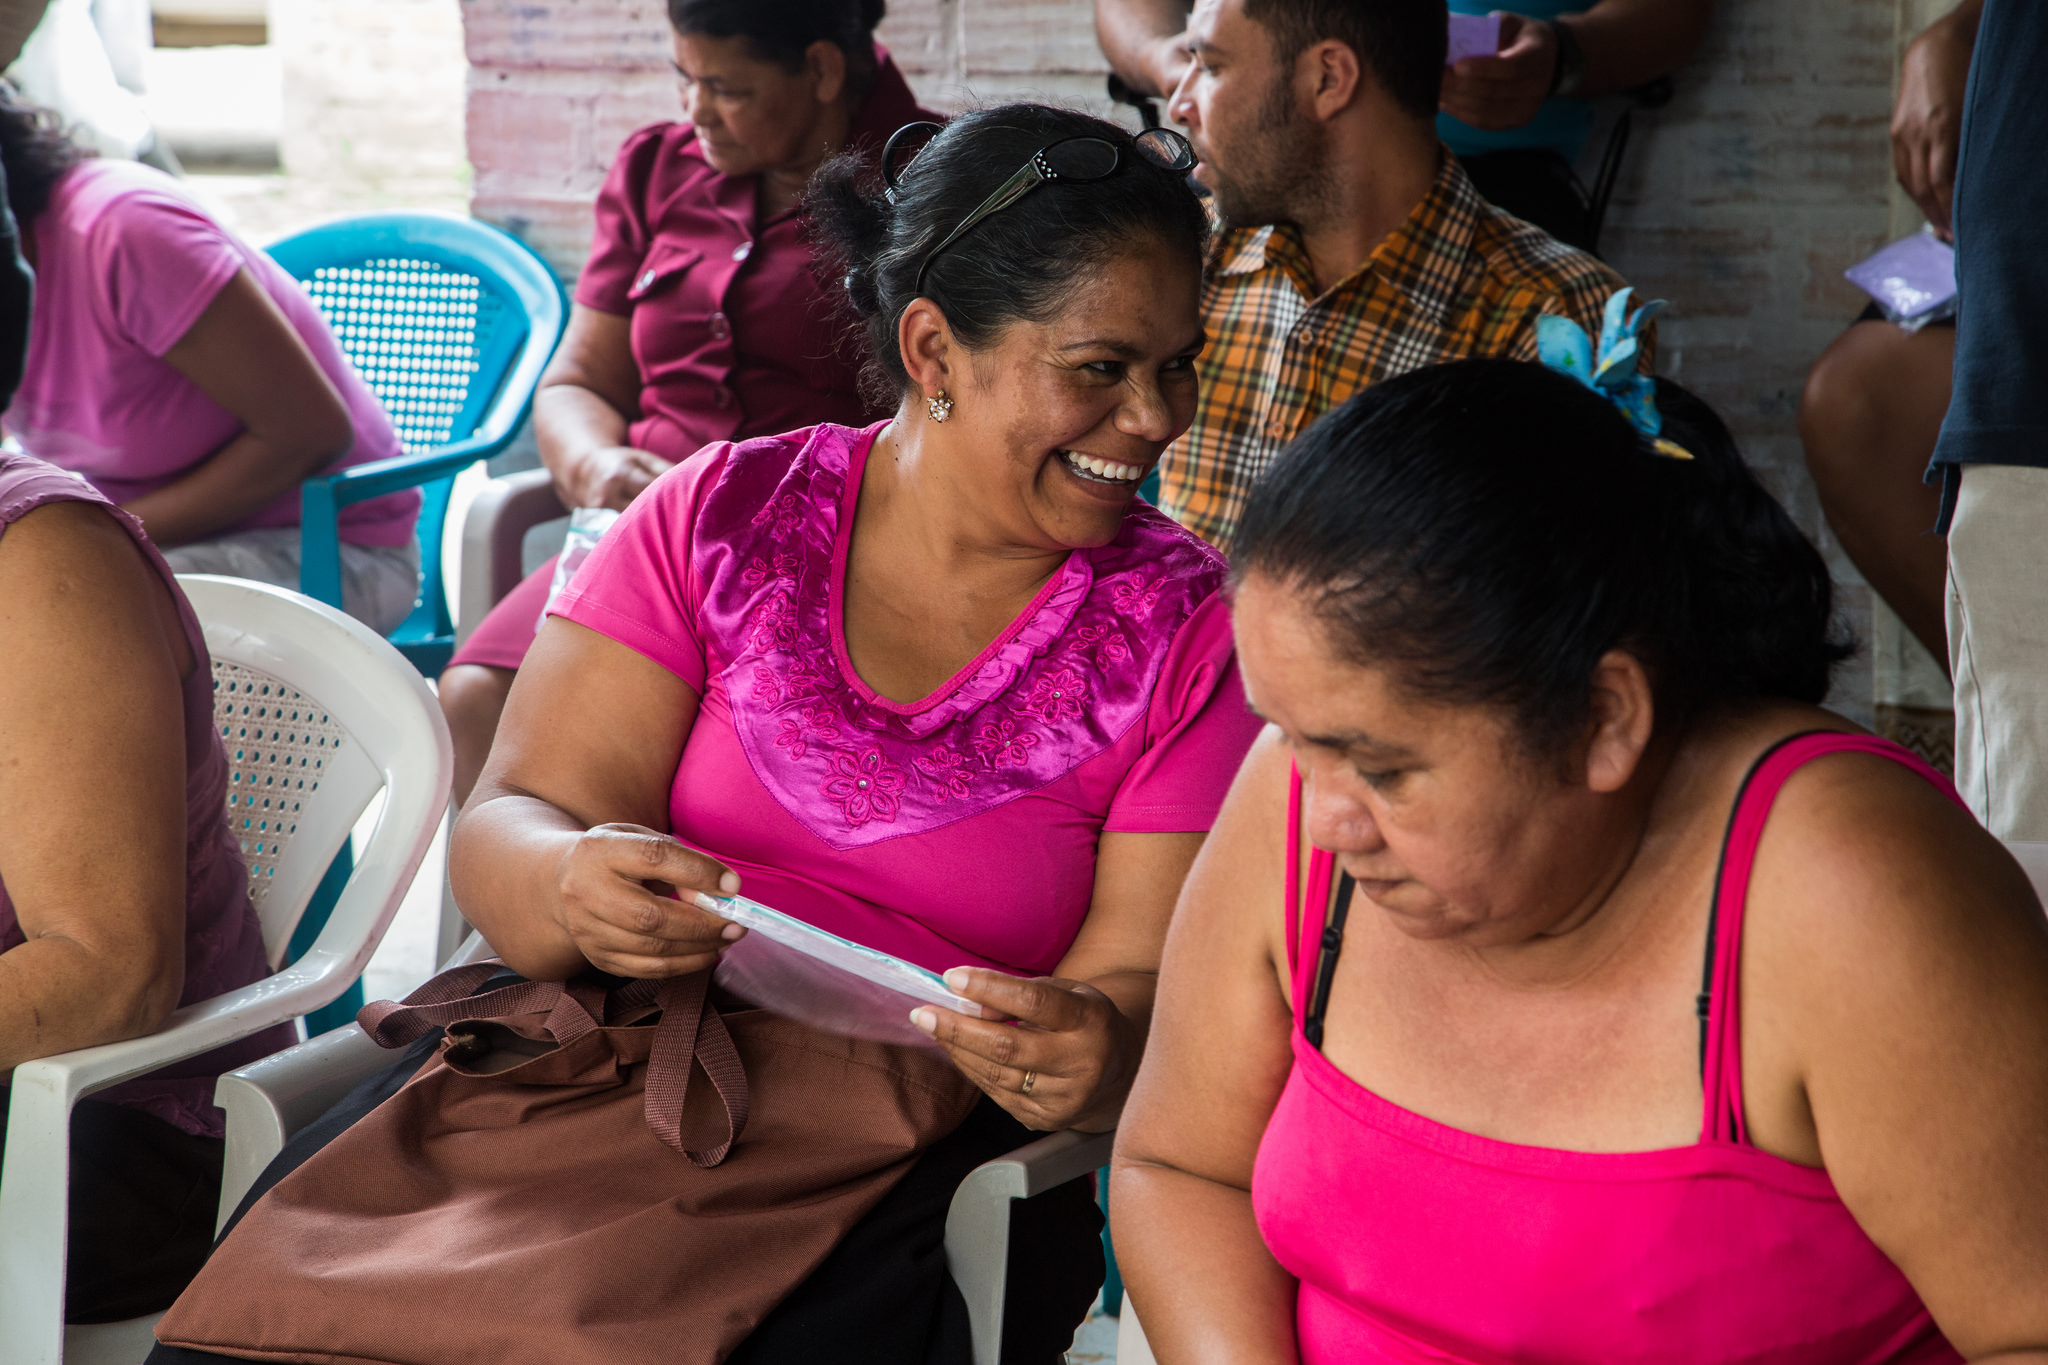
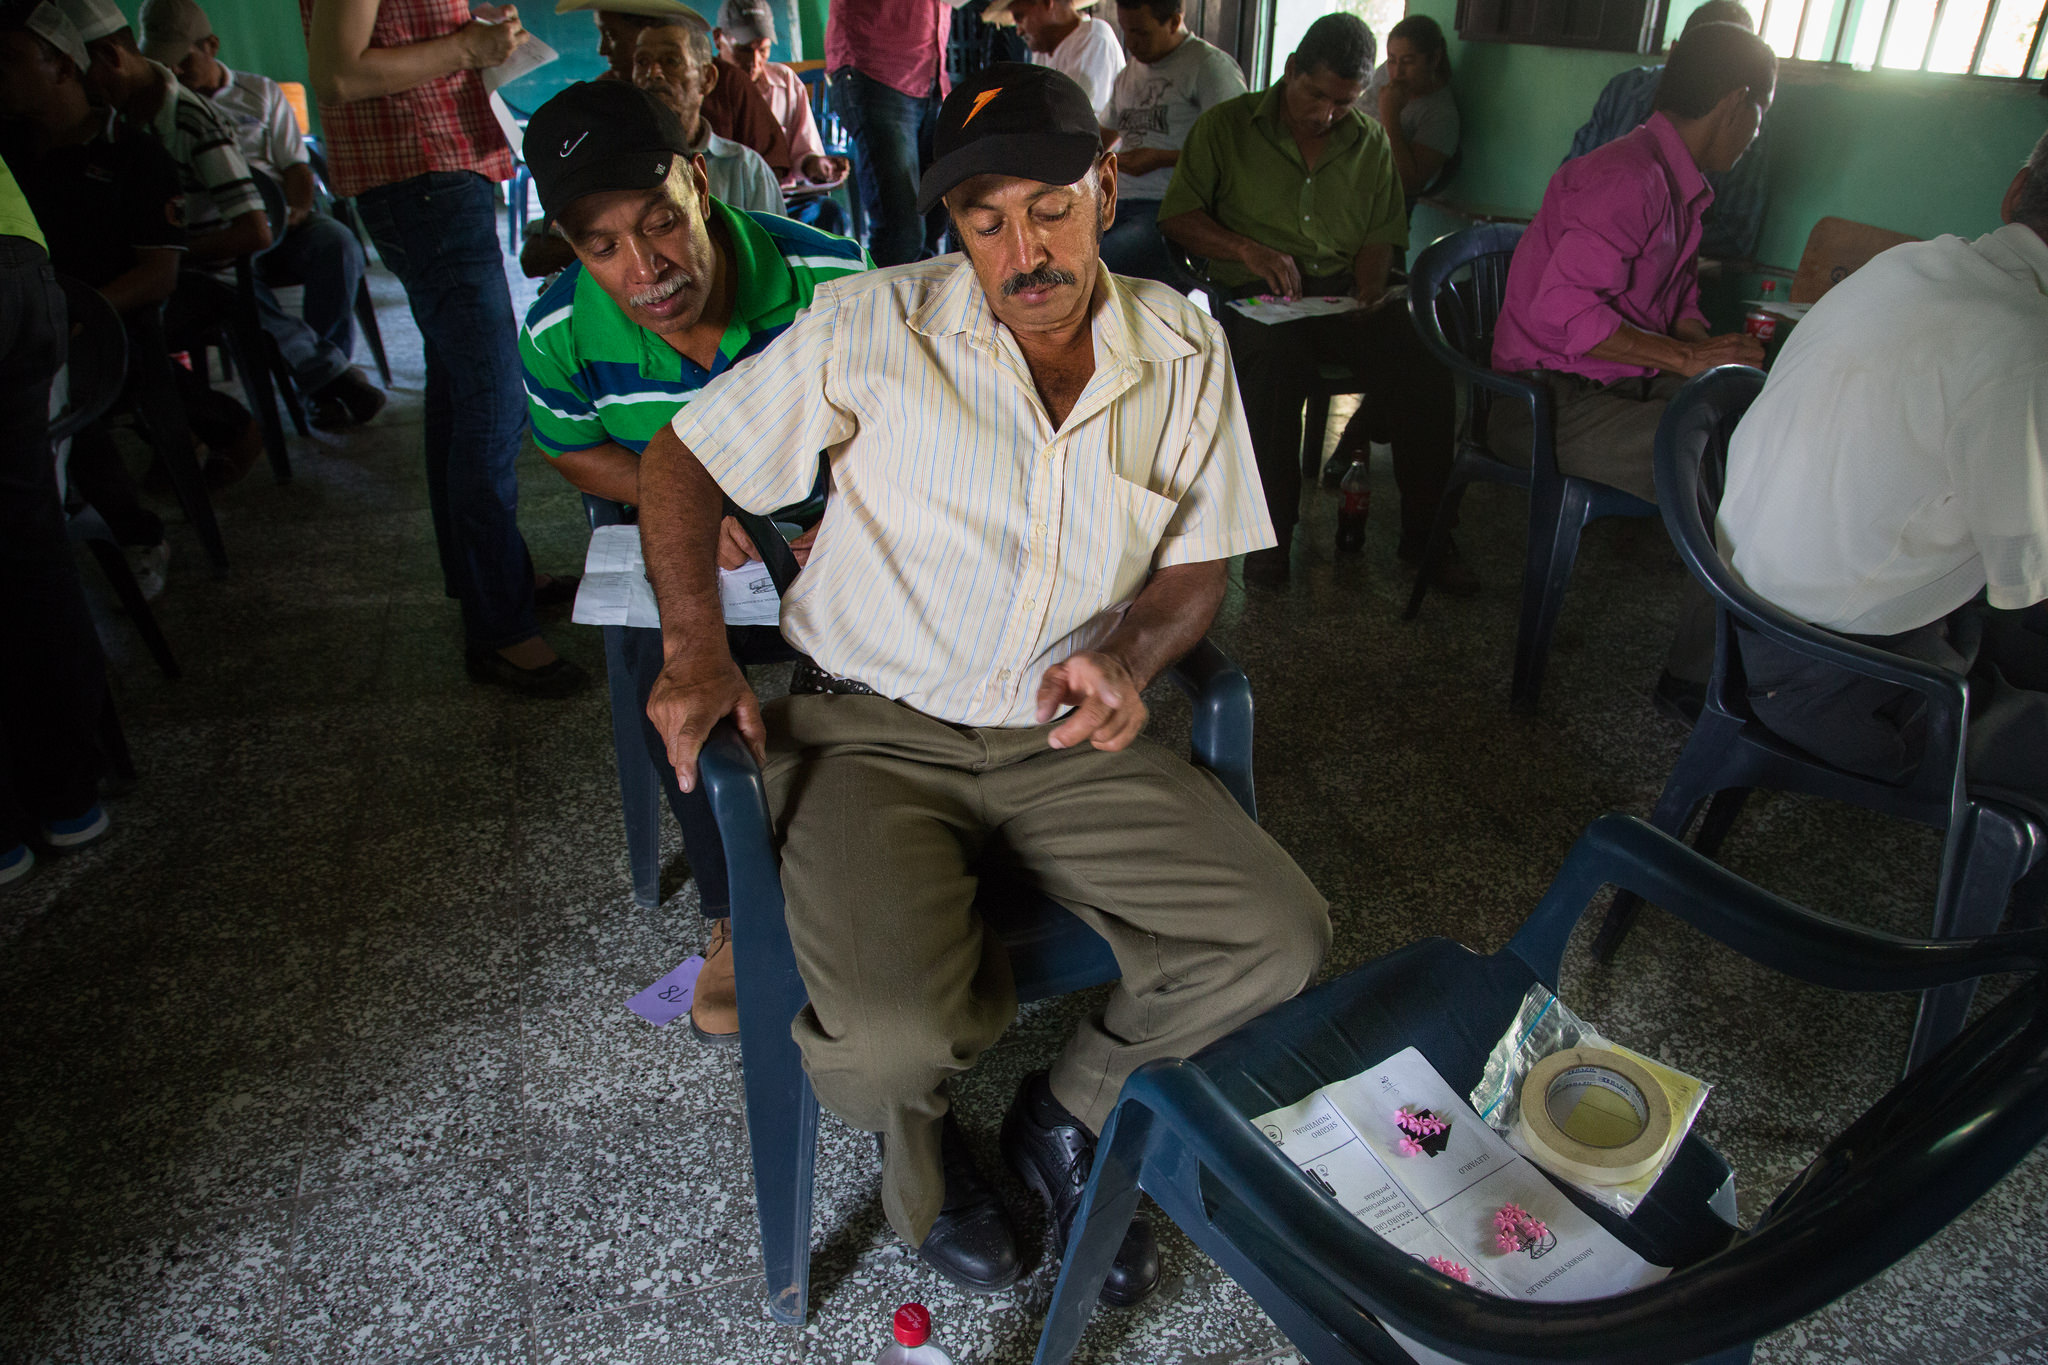
Farmers during an index insurance game session in southern Honduras, 2015. The first round of interactive exercises with farmers was in 2014. During those exercises, Martínez and her team learned more about key periods when lack of rainfall is most harmful to beans and maize production. If there isn’t enough rainfall at the beginning of each season, for example, farmers can’t plant and risk losing the money they spent (or loaned) to buy their seeds.
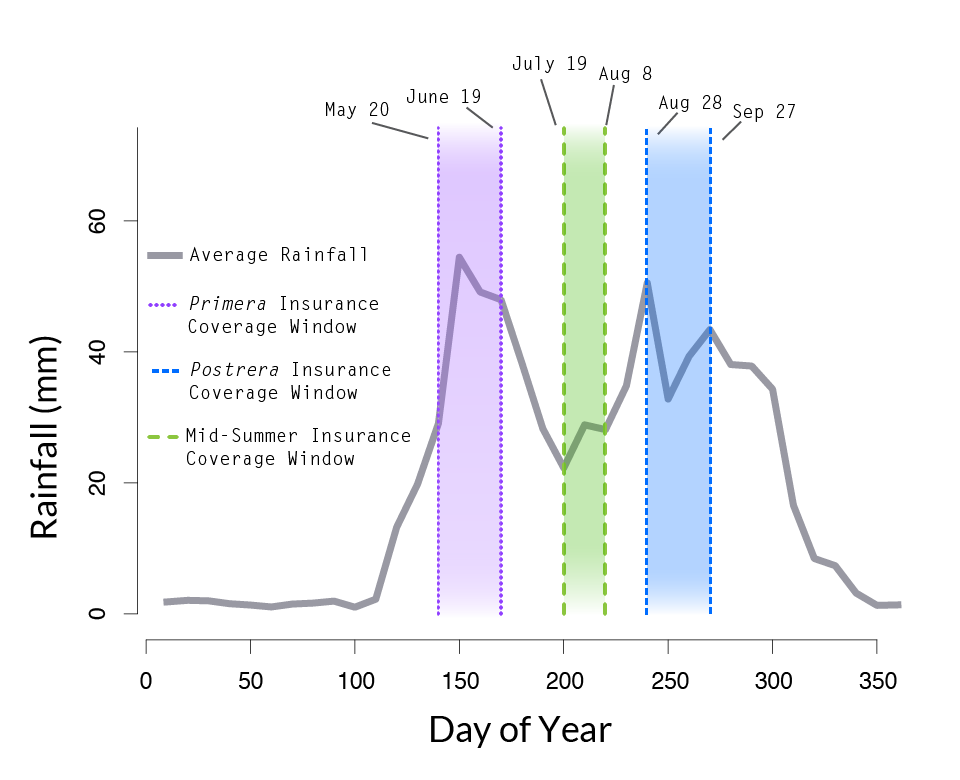
The researchers also learned more about the two agriculture seasons. The first season, “primera,” typically begins around mid-May and extends through mid-August. In recent years, said Martínez, the rains haven’t started until later in May, sometimes not even until mid-June, forcing the rain-fed farms to delay production and risk key stages of crop development that occur during the mid-summer drought—a period in July when rains usually taper off. 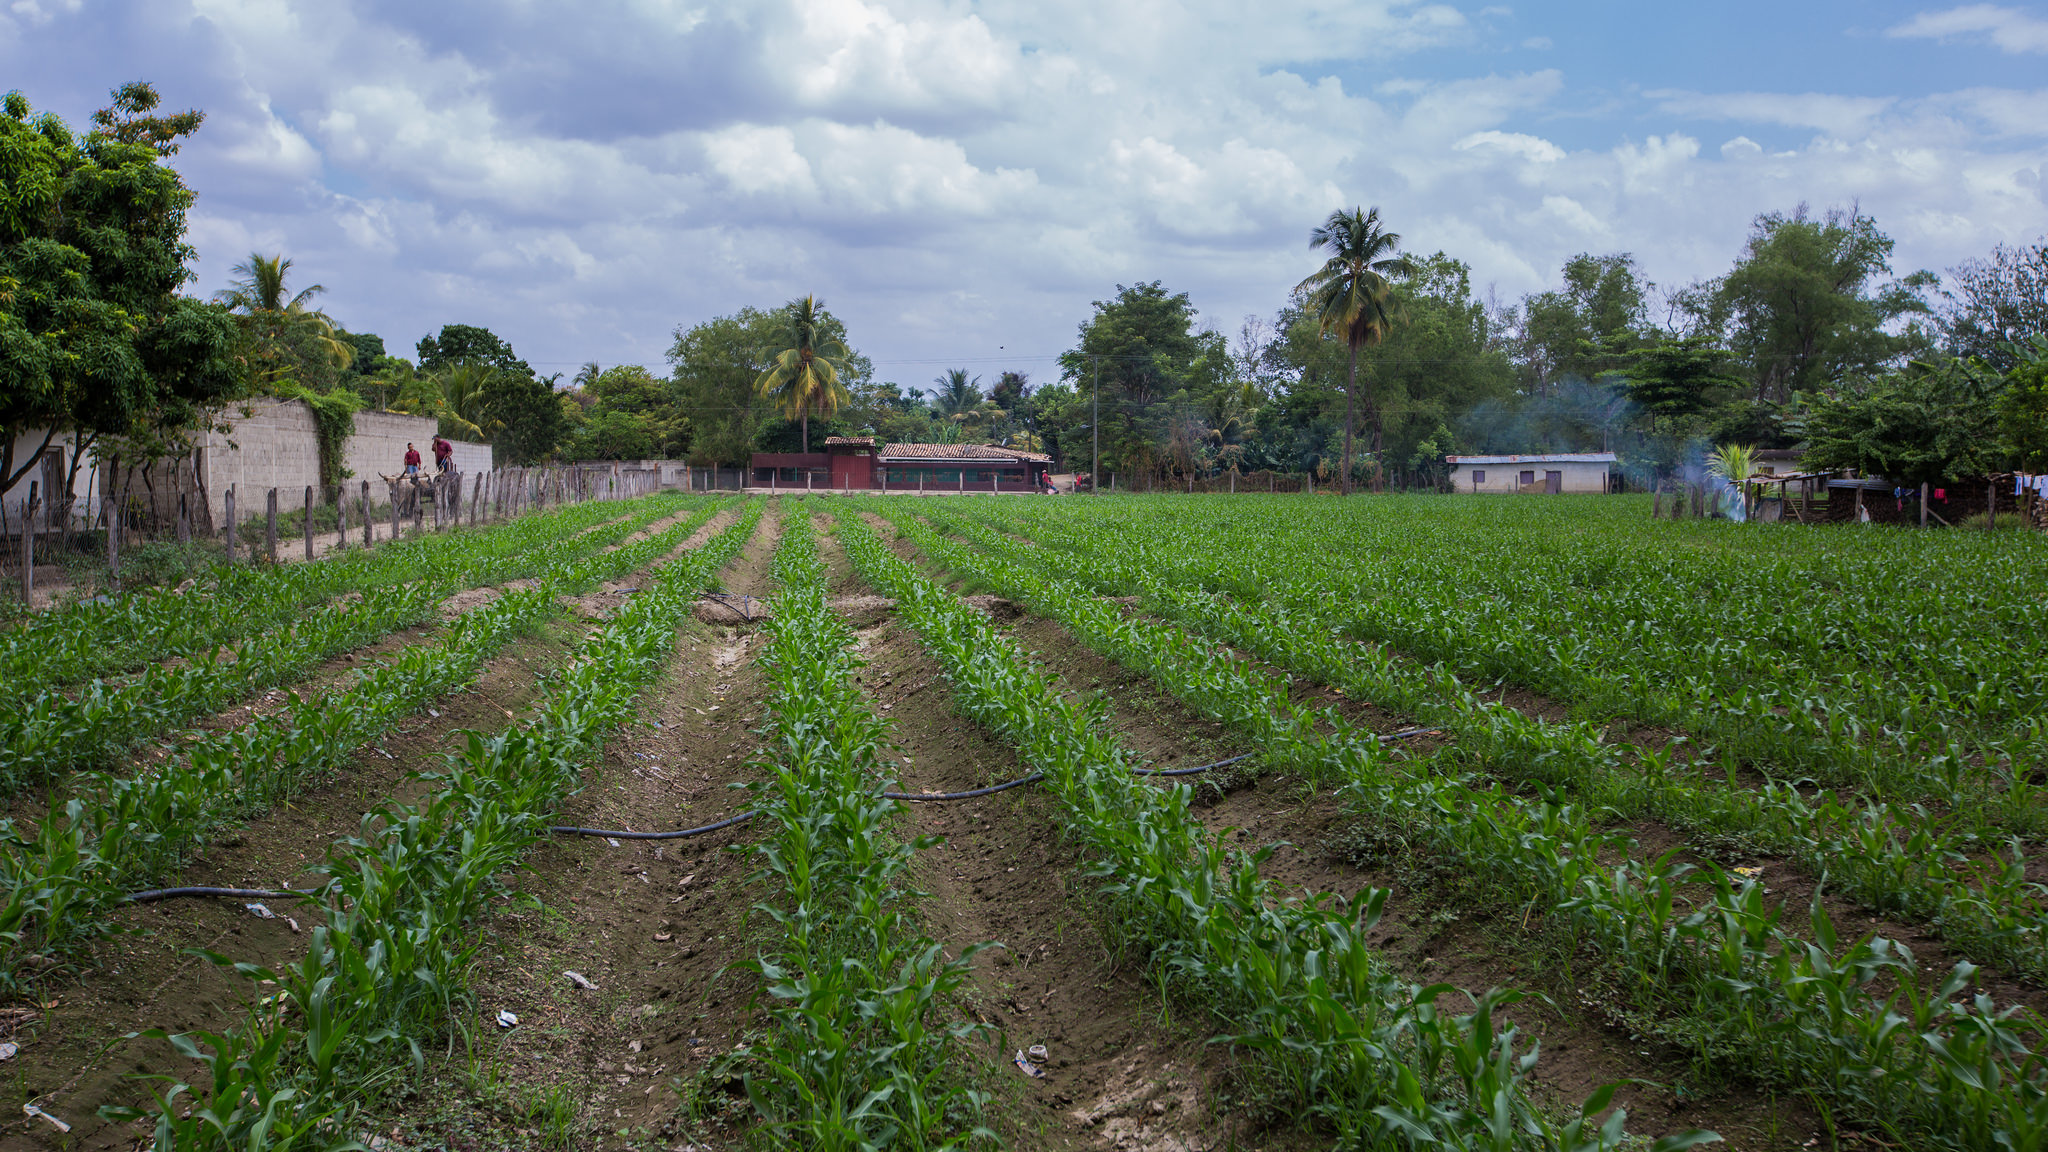
During the first season, production is concentrated around maize, usually a 90-day variety, said Martínez. Most farmers in the region that we work in have a practice of leaving the maize to dry in the field before harvesting, so around mid-August they will bend the maize plant and let it dry for another couple of weeks. 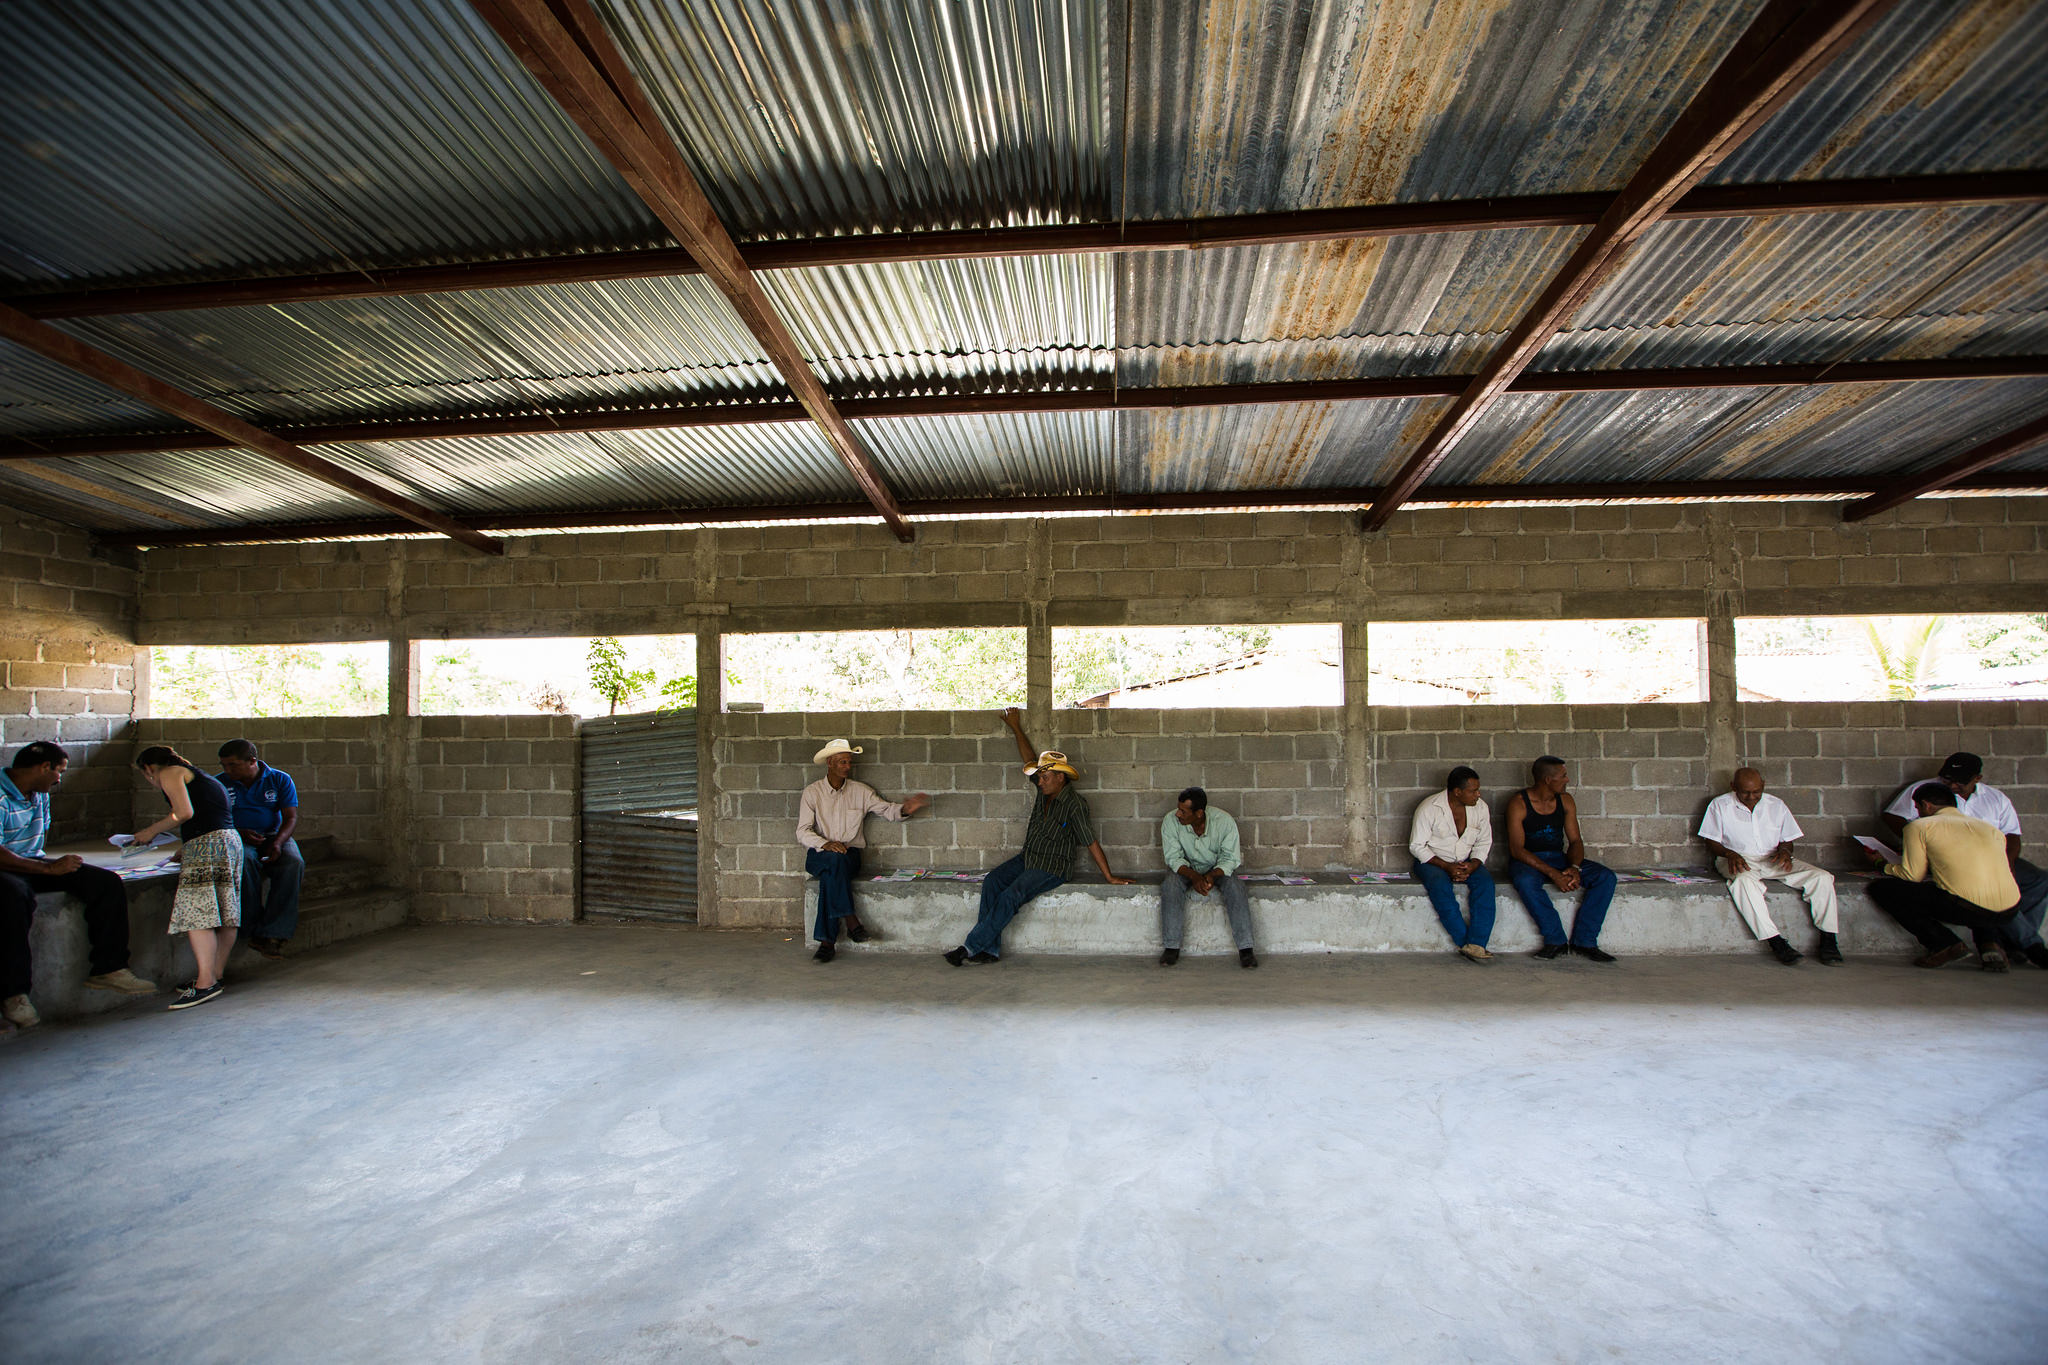
The second season or “postrera” usually begins around late-August or early-September, depending on when there is enough rainfall. Farmers plant mostly beans during this season because their shorter crop cycle matches what tends to be a shorter rainy period at this time of year. But, when primera doesn’t have a good production year, some farmers will plant both beans and maize during the postrera season, even knowing that maize production won’t be as fruitful as it would be in a typical primera season. 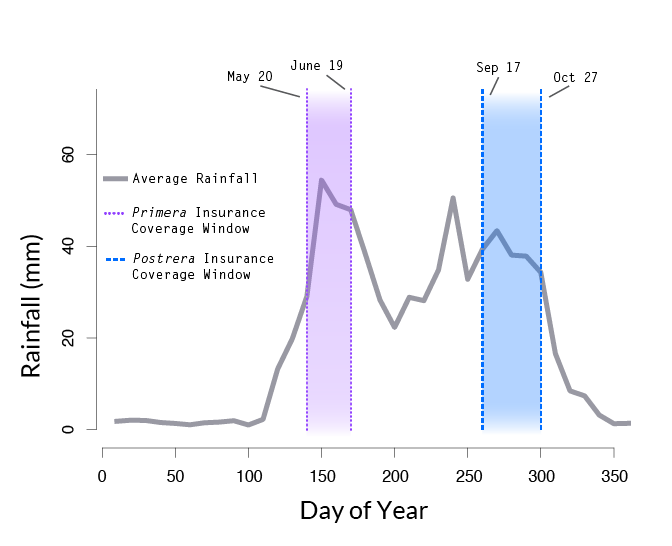
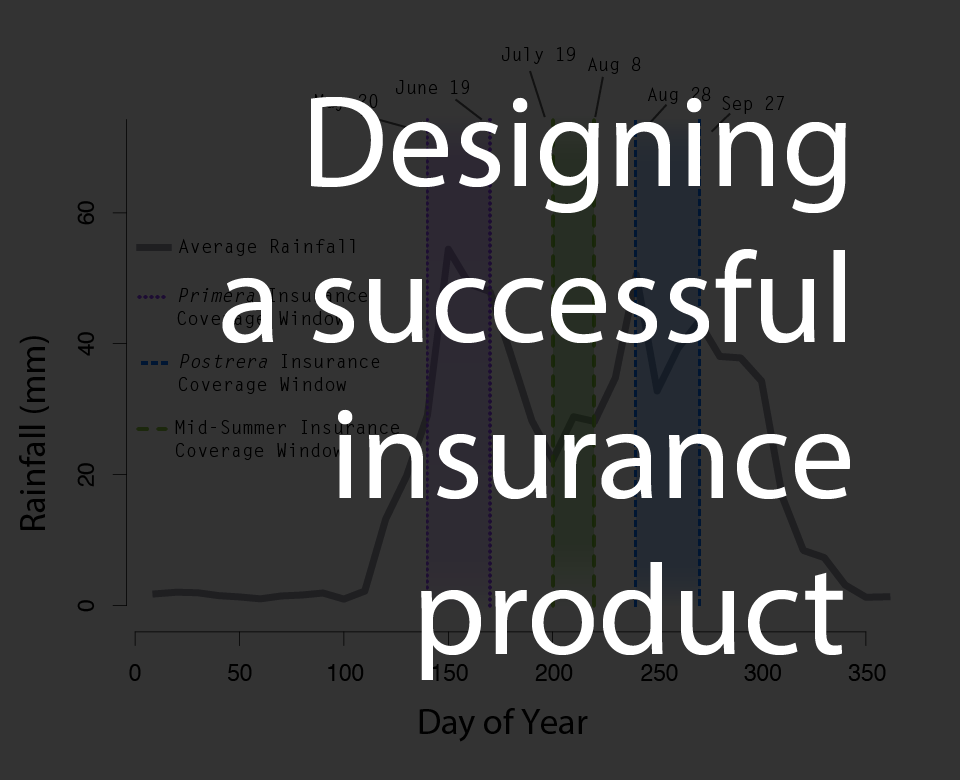
Based on the farmer feedback from the first round of games, the first iteration of index insurance design narrowed in on the rainfall windows only at the beginning of each of the two main growing seasons. These windows captured much of the risk from the years in which the farmers reported the most losses.
(Figure note: Rainfall is shown in 10-day totals, averaging over the 1981-2015 time period)
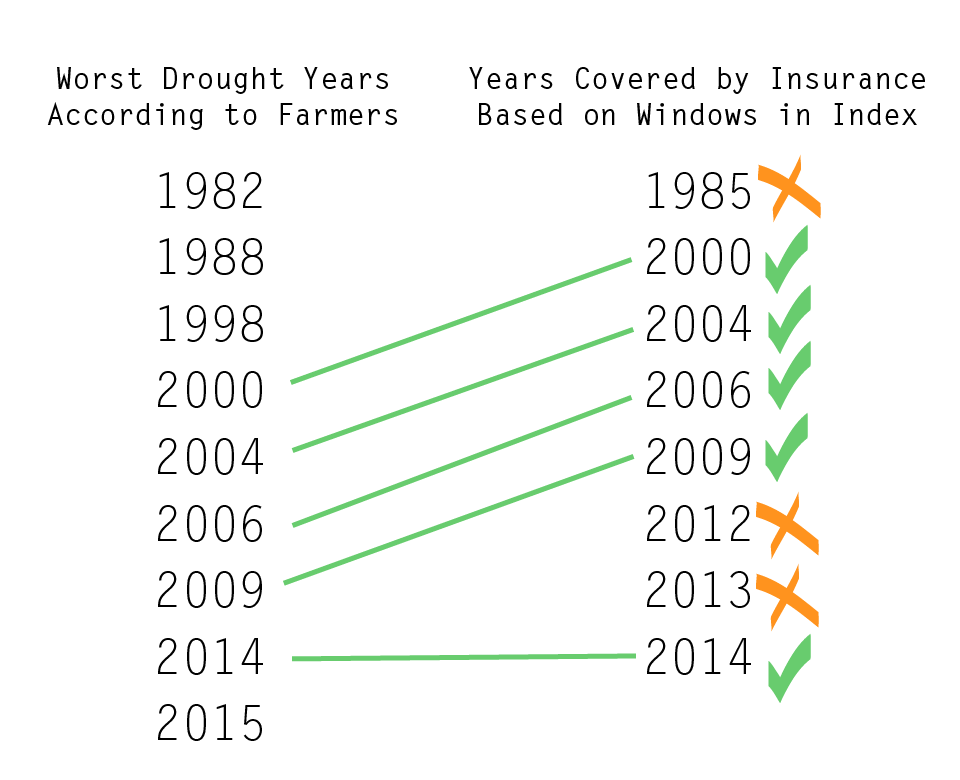
But several years of drought-induced losses reported by the farmers weren’t showing up in the index insurance design.
From this second round of exercises, the team realized they needed to shift the coverage for the second season to make sure that they were capturing some of the farmers’ worst years.
The next iteration of testing the insurance product came in May 2015, with the exercises described at the beginning of this story.
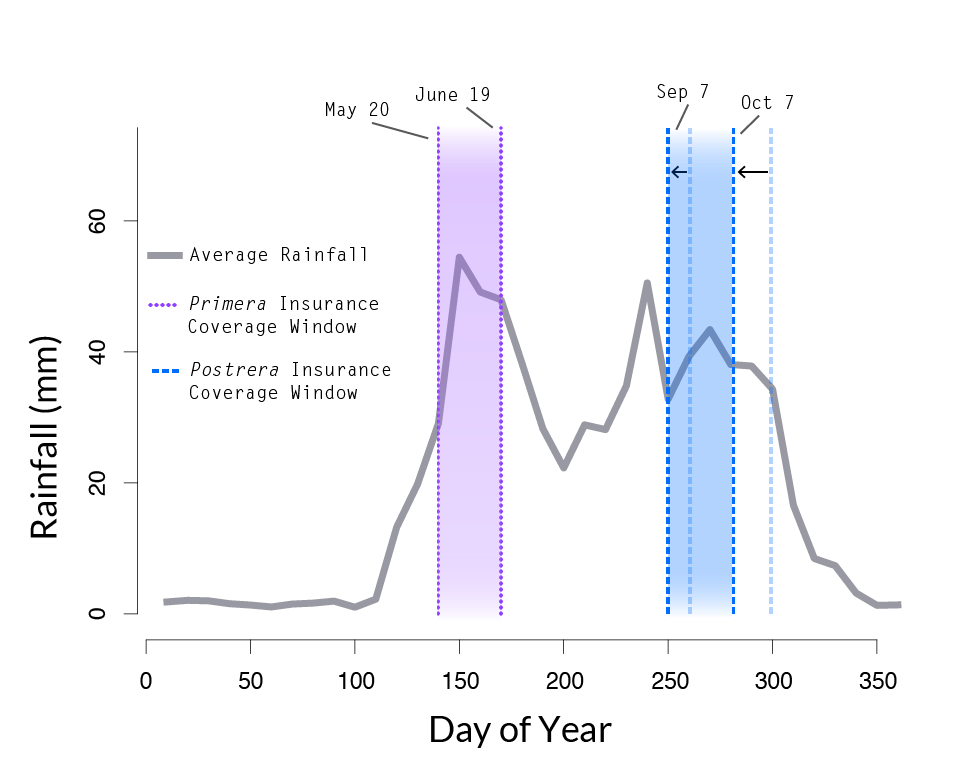
From this third round of exercises the team learned that they needed to add another window of coverage towards the end of the first season. According to the farmers, said Martínez, the most important time is just after the flowering. If the farms don’t get a second round of rains in late July and early August [i.e. if the mid summer drought expands], then the crops grow but don’t give any fruit, she said. This period of rainfall turned out to be critical enough to be included in the insurance product.
The importance of this period was underscored just after the May 2015 exercises. In the summer of 2015, said Martínez, the post-flowering rains didn’t come. It never rained again during the first season after planting, and then the second season was late to start.
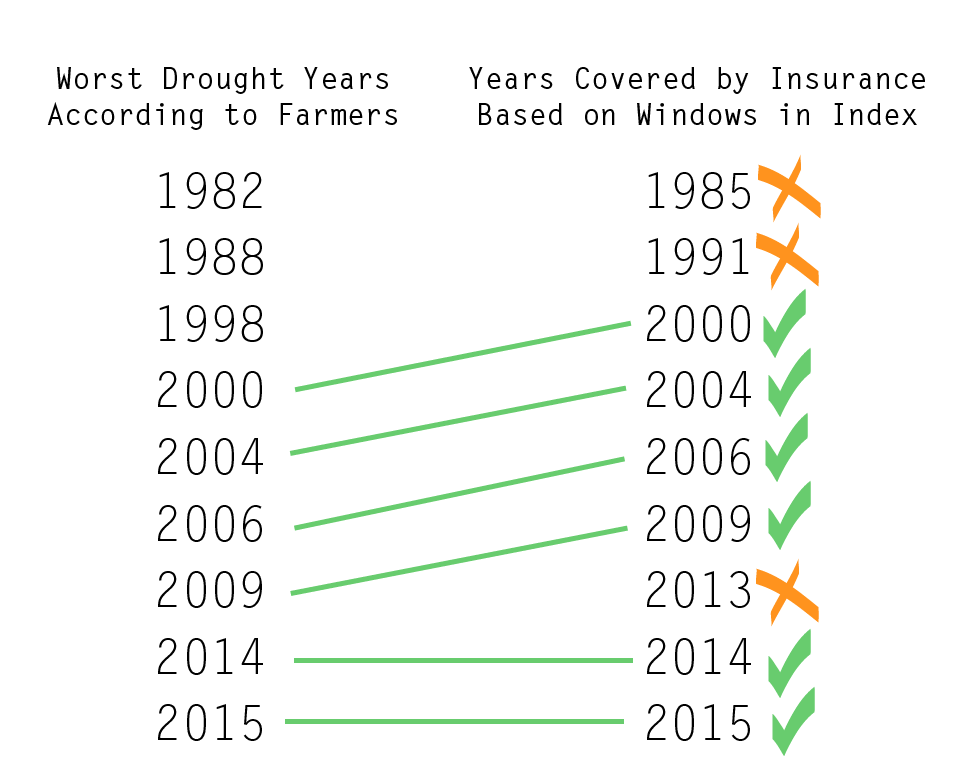
After refining the product, the insurance captures most of the years when farmers would have needed a payout, according to the worst drought years gathered through the games and discussions with farmers. The team focused on ensuring that the recent worst out of all the years were captured in the design of the insurance product: 2000, 2009, 2014, 2015. With the last iteration of the design, including the additional window, the team was successful in capturing the severe 2015 drought.
The progression of the three iterations of index insurance product design in Honduras. The third design is close to the product being finalized for sale to farmers today.
Once the farmers’ records and the insurance payouts match up well enough historically, the farmers and insurance providers can be more certain the product will work for both parties going forward.
A New Generation of Index Insurance
The index insurance product developed after Martinez visited the ten villages in southern Honduras has been shared with public and private institutions at a national level. They showed great interest and support, said Martínez. The IRI-CCAFS initiative, working closely with the local insurance regulator, has recently kicked-off discussions with a local insurance company to implement and plan scaling processes for a commercial version of the index insurance product, with support from key stakeholders including farmer associations and microfinance groups. Zamorano University, based near Tegucigalpa, and the agriculture ministry are also involved in the project to advance the use of satellite-based information for seasonal agricultural decisions.
By using both bottom-up and top-down approaches, the team hopes to transform current policies and regulations to make it easier for financial tools and other climate risk management strategies to be approved and implemented throughout the country.
“We want to ensure that small and medium-sized producers who are usually marginalized by the existing private sector tools are included in these financial products, by working together with the agriculture ministry and the insurance sector regulator,“ said Martínez.
The results and the process itself will be applicable to other countries in the region that have similar political and social contexts. “It’s no longer just a project,” Osgood said. “It’s a new step forward for index insurance, the first of a new generation for this financial product.”
And since a lot of climate change adaptation efforts, not just those related to insurance, involve new technology uptake, he said this initiative provides lessons to other adaptation projects around the world.
“In our experience, the projects that build off of bottom-up exercises and give farmers a voice are the most successful projects, and the particular success of the Honduras work demonstrates a way forward for effectively applying climate information in decisions around the world,” Osgood said.
This project and story were funded with the support of: the United States Agency for International Development; the CGIAR Research Programme on Climate Change, Agriculture and Food Security; the National Science Foundation through Columbia University’s Center for Research on Environmental Decisions (NSF SES-0951516 and SES 0345840); and Columbia University’s Earth Institute.